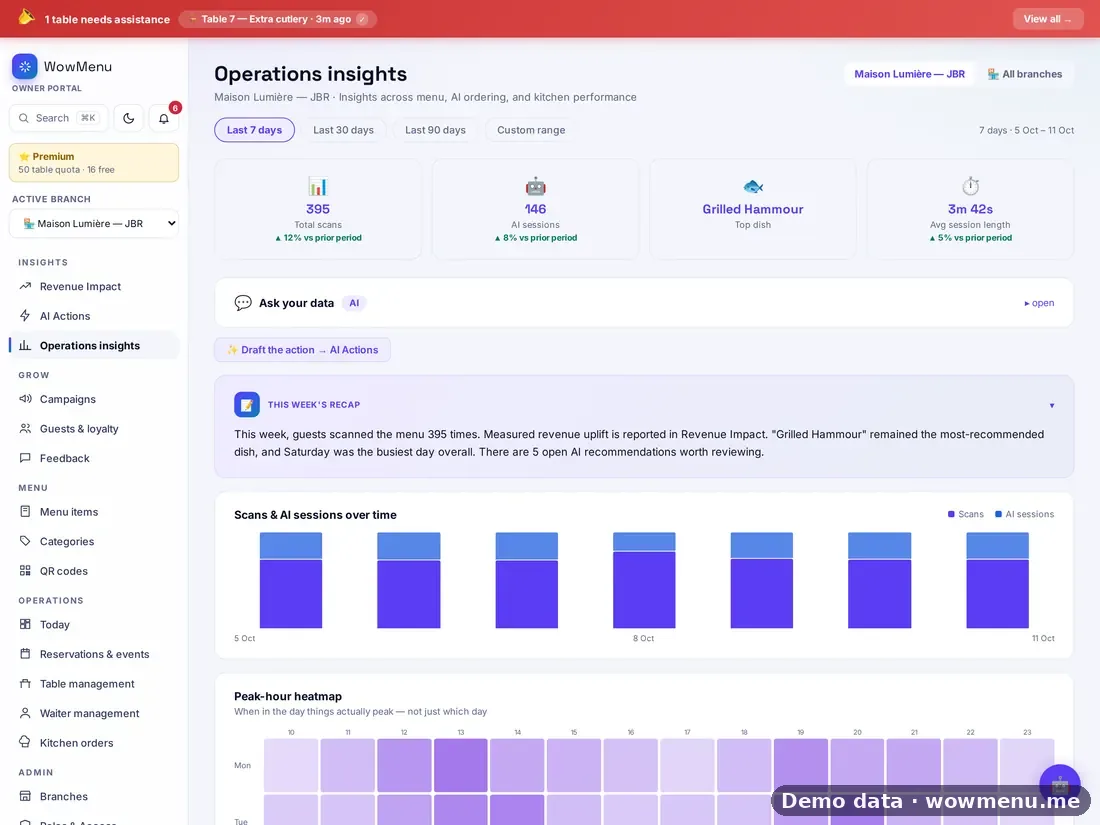
Operations insights give you the everyday picture of how the restaurant is performing. You see scan and order trends, average bill, and top dishes by guest engagement, with a table and section breakdown and the split between dine-in and takeaway.
A peak-hour heatmap (day by hour) and table turnover, split by lunch and dinner, show where capacity is wasted. A language view shows which menu languages guests actually use.
Ask your data lets you type a question about slow days, top dishes, revenue or channels and get an answer built from your own numbers, plus a weekly recap. It answers a defined set of common questions from live metrics, so treat it as a quick answer rather than an open-ended AI chat. To see what WowMenu itself adds to your bill, use Revenue Impact.
MenuGPT usage analytics are included on Menu. Multi-branch consolidated analytics are on Suite. Examples on this site use demo data.
How it connects
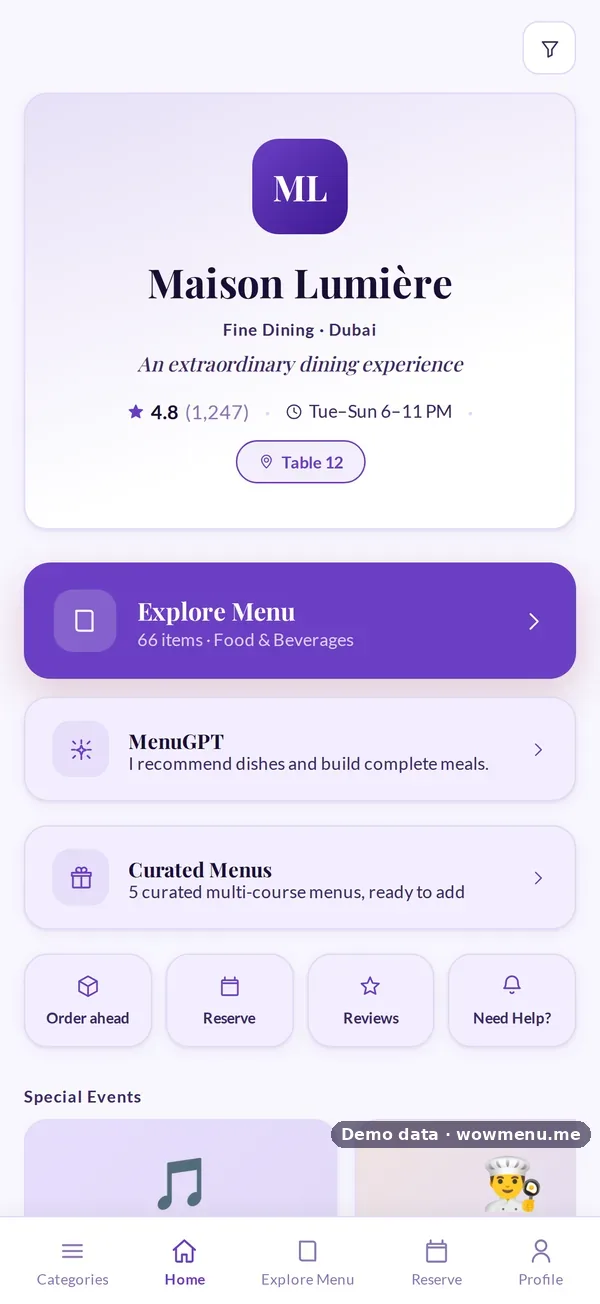
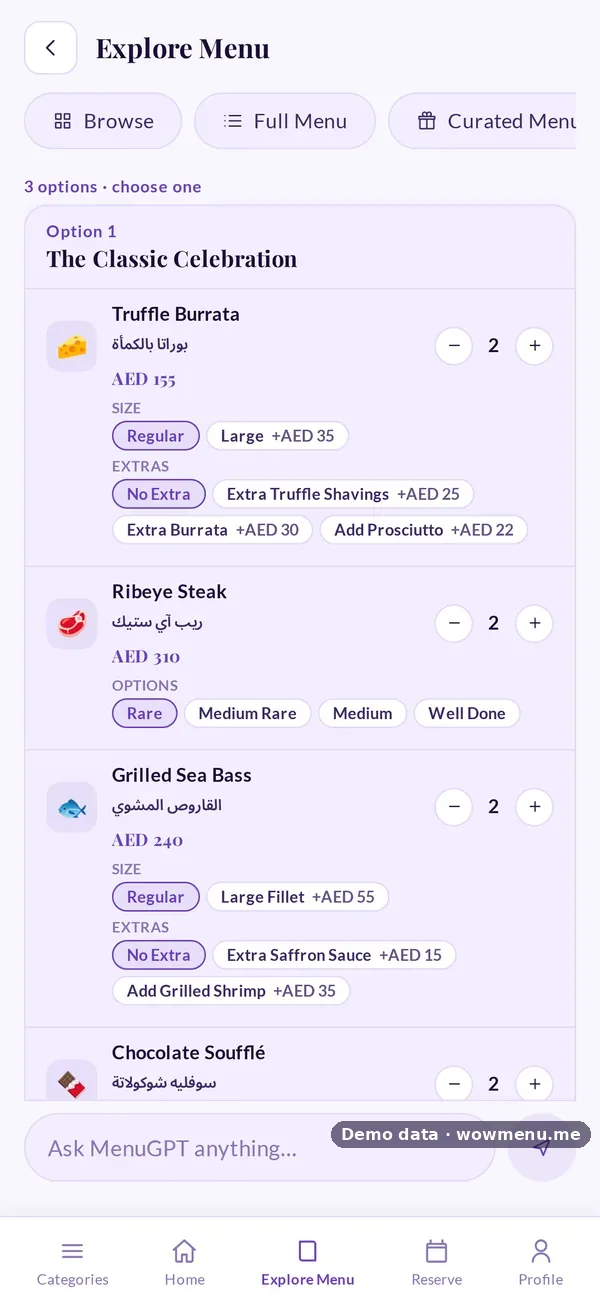
What the owner sets up or sees in the portal, and what the guest sees in the QR menu. Screens are from the demo restaurant, Maison Lumière, with demo data.
Guest taps become the owner dashboard
Scans, MenuGPT sessions and orders from the QR menu feed the scans-over-time chart, the peak-hour heatmap and the weekly recap.
Key benefits
What Restaurant Analytics does for your restaurant
Peak-hour heatmap
Day by hour, so you see which services drive revenue and where capacity sits idle.
Table turnover, lunch and dinner
Turnover split by lunch and dinner, with a table and section breakdown.
Language mix and channel split
Which menu languages guests use, and the split between dine-in and takeaway.
Ask your data
Type a question about slow days, top dishes, revenue or channels and get an answer built from your own numbers, plus a weekly recap.
How it works
Orders and scans feed the numbers
Every scan, order and table session adds to your trends.
Read the rhythm
Use the heatmap, turnover and section views to see where service is strong and where it is idle.
Ask a question
Ask your data answers common questions from your live metrics.
Prove the effect
Revenue Impact compares your weeks with your own baseline.
Frequently asked
What does Ask your data answer?
A defined set of common questions about slow days, top dishes, revenue and channels, answered from your live metrics. It is not an open-ended AI chat.
Can I see which languages my guests use?
Yes. The analytics show which menu languages guests actually use.
Do analytics cover several branches?
Multi-branch consolidated analytics are on the Suite plan.
How do I see what WowMenu adds to my bill?
Use Revenue Impact, which compares your weeks with your own pre-launch baseline.